See your cloud spend beside your telecom spend
Read the Cloud page, see AWS, Azure and Google Cloud costs by provider, service and account, compare them with telecom, and act on the findings.
In the app:Cloud spend
On this page
The Cloud page shows what your company spends on Amazon Web Services (AWS), Microsoft Azure and Google Cloud, next to what it spends on telecom. You can see how it splits by provider, service and account, and spot a cost that jumped. Conduit TEM reads the monthly cost file each provider lets you download, so nobody has to give Conduit TEM access to your cloud accounts.
Cloud spend is part of the Business and Enterprise plans. On another plan, the Cloud page explains the feature and shows See plans to owners and admins. See Plans, limits and billing.
Open the Cloud page
- Once your company has uploaded its first cost file, Cloud appears in the menu on the left. On a phone, it's under More.
- Before that, open it from the search box at the top (type "Cloud spend"), or from Settings → Import data with Open cloud spend.
The page has three tabs:
- Overview: the figures and charts described below.
- Accounts: your cloud accounts and where their spend is placed in your company.
- Imports: upload a cost file and see past uploads.
If the page is empty, nobody has imported a cost file yet. Start with Import a cloud cost file.
Read the figures at the top

- Cloud spend is the latest month's cloud total, with the change from the month before. If the month isn't over yet, the label says to date. The month is then compared with the same days of the previous month (for example "vs Aug 1–15"), so a half month never looks like a drop.
- Telecom spend is your telecom total for the same month, from posted bills and imported history. The line below it shows how much of the two together is cloud.
- Untagged spend is the share of the month with no tags. Tags are labels your IT team puts on cloud resources, such as a cost centre or a team. Spend without them can only be placed by account.
- Cloud findings is the number of things worth a look this month (see below).
Read the charts
- Spend by month shows the last 6 months, split by provider. Select Service to split it by service instead, and 12 mo to see a year.
- Top services and Top accounts rank the latest month. An account is an AWS account, an Azure subscription or a Google Cloud project.
- By provider shows each provider's share when you use more than one.
- Telecom and cloud puts both side by side, month by month.
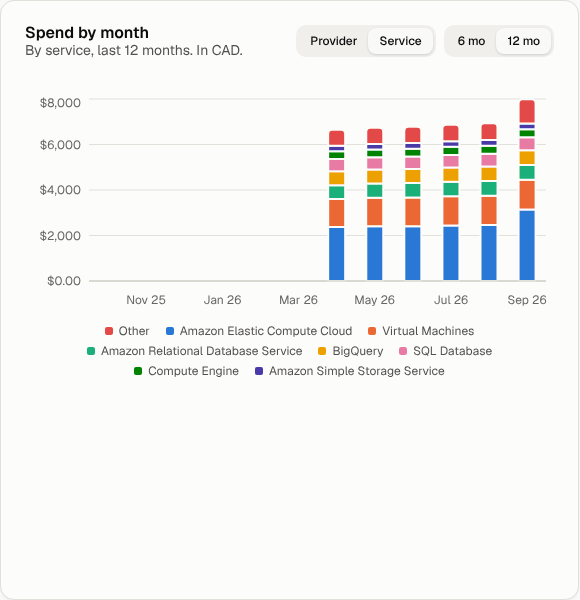
All amounts are in your organization's currency. If a cost file was in another currency, that spend is kept as it is and never converted. It's left out of the charts, and the figures say so.
Act on the findings
The Findings card compares the last full month with the month before it:
- Spend spike: an account or one of its services rose by more than a quarter, and by at least 100 in your currency.
- New service: an account started paying for a service it never used before.
- Untagged spend: more than a fifth of an account's month has no tags.
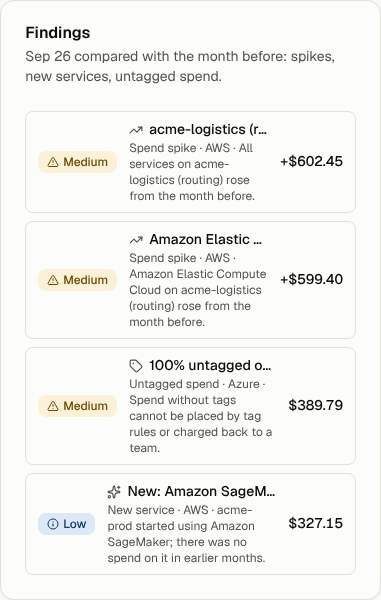
Each finding has a severity (High, Medium or Low) and the amount involved. Share a spike or a new service with whoever runs that account, and ask your IT team to tag untagged resources. Fixes show up the next time you import that month.
Tip: cloud findings appear on the Cloud page only. They are not in the Anomalies list with the bill findings.
Look at one part of the company
Use the location picker at the top of the menu, as on every other page. The Cloud page then shows only the spend placed in that location or cost centre. Members who are limited to part of the company only ever see their part. To decide where spend goes, see Place cloud spend in your company.